Introduction
As Universiti Teknikal Malaysia Melaka (UTeM) continues to expand its academic horizons, we are closely monitoring the environmental impact of our growth. A recent analysis covering July 2021 through June 2025 reveals a critical correlation: as our student population thrives, our energy consumption and CO2 emissions have followed suit.
The Challenge of Expansion
Our data shows a direct linear relationship between the influx of new talent and our utility requirements. While a growing campus is a sign of success, it presents a significant sustainability challenge.

Key Observations (2021–2025)
- Energy Surge: Higher demand for campus facilities, laboratories, and residential cooling has driven electricity usage upward.
- Carbon Correlation: CO2 emissions have mirrored student enrollment trends, highlighting the need for more efficient campus infrastructure.
- The "Per Capita" Factor: While total emissions are up, we are currently analyzing our emissions per student to determine if our efficiency measures are keeping pace with our scale.
Why This Matters
Transparency is the first step toward a greener UTeM. By identifying that our carbon footprint is tied to our population growth, we can move away from general solutions and toward targeted sustainability initiatives, such as:
- Smart Campus Retrofitting: Implementing AI-driven HVAC and lighting systems to reduce waste in high-traffic student areas.
- Renewable Integration: Expanding solar harvesting to decouple energy growth from carbon emissions.
- Behavioral Change: Empowering our growing student body to lead the way in energy conservation.
Our Commitment: UTeM is dedicated to ensuring that a larger student body doesn't mean a heavier burden on the planet. We are transforming these insights into a roadmap for a Net-Zero Campus.
Energy Consumption and CO₂ Emissions Trend

Fig. 1 and Fig. 2 illustrates the trend of annual energy consumption (kWh) and corresponding Scope 2 CO₂ emissions (metric tons) over the period from July 2021 to June 2025. The key observations are as follows:
- July 2021 – June 2022:
Energy consumption was recorded at 10,782,204 kWh, resulting in 9,057.05 metric tons of CO₂ emissions. - July 2022 – June 2023:
Consumption increased significantly to 13,061,740 kWh, with emissions rising to 10,971.86 metric tons. - July 2023 – June 2024:
A continued upward trend was observed, with energy usage reaching 14,877,103 kWh and emissions at 12,496.77 metric tons. - July 2024 – June 2025:
Energy consumption showed a marginal increase to 14,964,694 kWh, while CO₂ emissions slightly rose to 12,570.34 metric tons, representing the highest recorded values in the period.
Overall, the data indicates a consistent upward trend in both electricity consumption and associated Scope 2 emissions, although the rate of increase begins to stabilize in the most recent year. This pattern suggests sustained growth in campus energy demand, likely driven by factors such as infrastructure expansion, increased occupancy, and intensified academic and operational activities. The slight plateau observed in the final year may also indicate early impacts of energy efficiency measures or improved energy management practices.
Student Population Growth and Its Impact
Below figure illustrates the trend in student population at UTeM over the corresponding reporting periods:
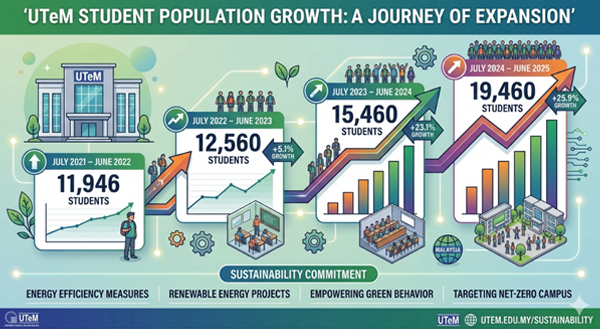
Between July 2021 and June 2025, the university’s student population increased by approximately 30.5%, with the most significant growth occurring between July 2023 – June 2024 and July 2024 – June 2025.
This upward trend in student enrolment aligns with the observed increase in energy consumption and Scope 2 CO₂ emissions. A larger campus population typically leads to higher demand for electricity due to expanded use of academic facilities, laboratories, residential colleges, and support services. The sharp rise in student numbers in the most recent period is likely a key contributing factor to the continued increase in energy usage and emissions, despite signs of stabilization in consumption growth.
